The Australia Inclusive Growth Score™

The Australia Inclusive Growth Score™

Empowering Australian communities with data-driven insights

Explore the map

Track your neighbourhood over time to see how you can promote inclusive growth and prioritize opportunities for revitalisation

Curious how the tool works? Check out the preview and create an account today!

help_outline

This is a preview of the application for demonstration purposes. Try the full experience →

Overview

Data-driven insights to measure inclusive growth

The Australian Inclusive Growth Score (AUS IGS) measures social and economic indicators at the Statistical Area Level 2 geography across the country using 21 key metrics from 8 different data sources.
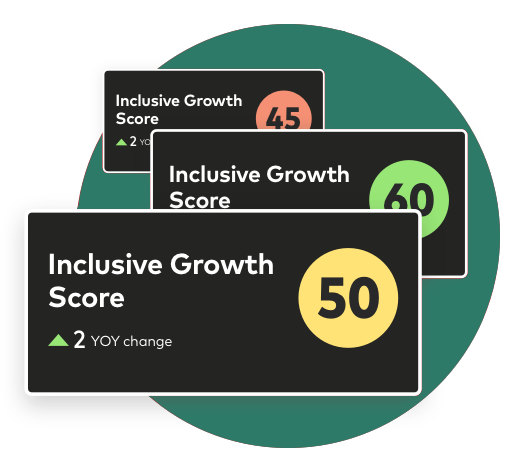
Data-driven insights to measure inclusive growth

Details

Place

Place

Housing, infrastructure, and the built environment

†Mastercard highly aggregated and anonymised transaction data.

  • Inclusion

    Inclusion: Level of access to key resources and assets.

  • Growth

    Growth: Level of change in performance over time.


  • Travel Distance to Work

    Travel Distance to Work

    This metric measures the distance between workers' homes and workplaces

    Australian Bureau of Statistics


  • Public Transit Usage

    Public Transit Usage

    This metric measures the percentage of workers who use public transport as their main mode of travel to work

    Australian Bureau of Statistics


  • Housing Affordablity

    Housing Affordablity

    This metric indicates the ratio between the median house price and the median household income

    Australian Bureau of Statistics, CoreLogic


  • Residential Real Estate Value

    Residential Real Estate Value

    This metric indicates the percentage growth of value of residential real estate

    CoreLogic


  • Newly Built Housing

    Newly Built Housing

    This metric measures the number of new dwellings completed over time

    Australian Bureau of Statistics, CoreLogic


  • Extreme Weather Events

    Extreme Weather Events

    This metric measures the number of extreme weather events that affect an SA2, such as heatwaves, floods, droughts, etc.

    Australian Bureau of Meteorology


  • Accessible Parkland

    Accessible Parkland

    Inclusion Metric Percentage of Nature conservation reserve and Multiple-use public forest as a percentage of total land in an SA2

    Australian Bureau of Statistics National Land Account

Economy

Economy

Business growth, jobs, and spending.

†Mastercard highly aggregated and anonymised transaction data.

  • Inclusion

    Inclusion: Level of access to key resources and assets.

  • Growth

    Growth: Level of change in performance over time.


  • Woman Owned Businesses

    Woman Owned Businesses

    This metric measures the percentage of female-owned businesses

    Australian Bureau of Statistics


  • Small Business Representation

    Small Business Representation

    This metric measures the percentage of their businesses are small (e.g. employing fewer than 20 people)

    Australian Bureau of Statistics


  • Commercial Diversity

    Commercial Diversity

    This metric measures the diversity of businesses based on their industry

    POI Provider


  • Gini Coefficient

    Gini Coefficient

    This metric measures how evenly or unevenly household income is distributed

    Australian Bureau of Statistics


  • Spend Growth

    Spend Growth

    This metric measures the percentage change in consumer spending over a period of time

    Mastercard†


  • Unemployment Rate

    Unemployment Rate

    This metric shows the number of people looking for a job but unable to find one

    Australian Bureau of Statistics

Community

Community

Economic and social conditions.

†Mastercard highly aggregated and anonymised transaction data.

  • Inclusion

    Inclusion: Level of access to key resources and assets.

  • Growth

    Growth: Level of change in performance over time.


  • Pre-School Access

    Pre-School Access

    This metric measures the percentage of children who attend pre-school (or equivalent early childhood education)

    Australian Bureau of Statistics


  • Distance to Nearest Hospital

    Distance to Nearest Hospital

    This metric measures the accessibility of hospitals based on the distance from an SA2 to the nearest hospital

    Australian Bureau of Statistics


  • Access to Education

    Access to Education

    This metric measures the number of schools that are contained within an SA2

    Australian Curriculum, Assessment and Reporting Authority


  • Rental Assistance Recipients

    Rental Assistance Recipients

    This metric measures the total number of households receiving rental assistance as a percentage of all households in the SA2

    Australian Institute of Health and Welfare


  • NDIS Participants

    NDIS Participants

    This metric measures the total number of NDIS participants as a percentage of all people living in the SA2

    National Disability Insurance Scheme


  • Private Insurance Coverage

    Private Insurance Coverage

    This metric measures the total number of people with access to private insurance as a percentage of all people living in the SA2

    Public Health Information Development Unit


  • Spending per Capita

    Spending per Capita

    This metric measures the average amount of money spent by each person

    Mastercard†


  • New Business

    New Business

    This metric measures how many new companies are formed every year

    Mastercard†

Metric Sources

Our Inclusive Growth Partners

  • The Paul Ramsay Foundation
  • Center for Social Impact

Success Stories

Coming Soon!

We're working on building success stories in Australia as we just launched the tool there. In the meantime, view these success stories from the United States and the United Kingdom.

Receive updates on new data sets, case studies and more.

The Inclusive Growth Score™

Find your score!

Neighborhood-level social and economic data on communities at your fingertips.

Login needed to access the data