The United States Inclusive Growth Score™

The United States Inclusive Growth Score™

Empowering U.S. communities with data-driven insights

Explore the map

The Inclusive Growth Score™ tool offers an interactive way to visualize the relative economic and social health of every census tract in the U.S.

Curious how the tool works? Check out the preview and create an account today!

help_outline

This is a preview of the application for demonstration purposes. Try the full experience →

Overview

Data-driven insights to measure inclusive growth

The United States Inclusive Growth Score (U.S. IGS) has yearly data at the census tract level, and is shown in the form of a percentile rank ranging from 0-100, with the average score at 50. It covers three pillars, Place, Economy, and Community, through 18 key metrics.
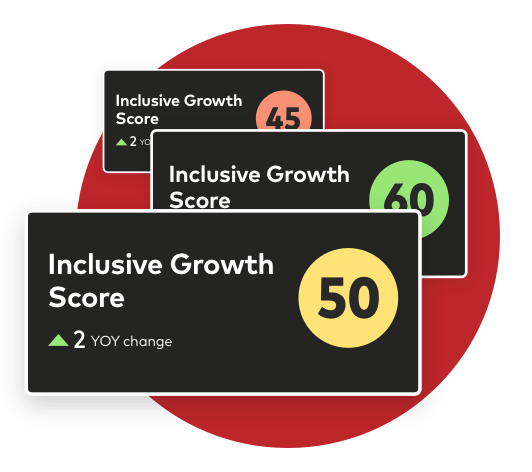
Data-driven insights to measure inclusive growth

Details

Place

Place

Housing, infrastructure, and the built environment

†Mastercard highly aggregated and anonymised transaction data.

  • Inclusion

    Inclusion: Level of access to key resources and assets.

  • Growth

    Growth: Level of change in performance over time.


  • Net Occupancy

    Net Occupancy

    Percentage growth in population of renter and owner-occupied housing units

    ACS 5-Year, Table B25008


  • Residential Real Estate Value

    Residential Real Estate Value

    Percentage growth of value of residential real estate

    ACS 5-Year, Table B25082


  • Acres of Park Land

    Acres of Park Land

    Percentage of designated tract land area that is park land

    Trust for Public Land, PAD-US


  • Affordable Housing

    Affordable Housing

    Percentage of renter and owner-occupied housing units where monthly costs are lower than 30 percent of income

    ACS 5-Year, Table B25106


  • Internet Access

    Internet Access

    Percentage of households with an internet subscription

    ACS 5-Year, Table B28011


  • Travel Time to Work

    Travel Time to Work

    Percentage of workers with travel time to work under 35 minutes

    ACS 5-Year, Table B08303

Economy

Economy

Business growth, jobs, and spending.

†Mastercard highly aggregated and anonymised transaction data.

  • Inclusion

    Inclusion: Level of access to key resources and assets.

  • Growth

    Growth: Level of change in performance over time.


  • New Business

    New Business

    Percentage growth of net new businesses based on anonymised and aggregated location data

    Mastercard†


  • Spend Growth

    Spend Growth

    Percentage growth of spending based on anonymised and highly aggregated indexed transaction data

    Mastercard†


  • Small Business Loans

    Small Business Loans

    Percentage growth of the number of small business loans

    Federal Financial Institutions Examination Council (FFIEC)


  • Minority/Women Owned Businesses

    Minority/Women Owned Businesses

    Percentage of Minority or women-owned businesses out of all businesses

    Commercial Data Provider


  • Labor Market Engagement Index

    Labor Market Engagement Index

    Index representing the combined employment, labor force, and percentage with bachelor's degree

    Housing and Urban Development (HUD)


  • Commercial Diversity

    Commercial Diversity

    Percentage of business types represented as a percentage of total possible business types

    POI Provider

Community

Community

Economic and social conditions.

†Mastercard highly aggregated and anonymised transaction data.

  • Inclusion

    Inclusion: Level of access to key resources and assets.

  • Growth

    Growth: Level of change in performance over time.


  • Personal Income

    Personal Income

    Percentage growth of per capita income

    ACS 5-Year, Table B19301


  • Growth in Spending Per Capita

    Growth in Spending Per Capita

    Percentage growth of average spend per person based on anonymised and highly aggregated indexed transaction data

    Mastercard†


  • Gini Coefficient

    Gini Coefficient

    Gini coefficient of income inequality (lower coefficient denotes lower inequality) represented through a percentage

    ACS 5-Year, Table B19083


  • Early Education Enrollment

    Early Education Enrollment

    Percentage of population under the age of five enrolled in early education programs

    ACS 5-Year, Tables B14001, B01001


  • Female Above Poverty

    Female Above Poverty

    Percentage of females living above the poverty

    ACS 5-Year, Table B17001


  • Health Insurance Coverage

    Health Insurance Coverage

    Percentage of the eligible population with health insurance coverage

    ACS 5-Year, Table B27020

Metric Sources

Our Inclusive Growth Partners

  • Accelerator for America
  • Urban Institute
  • The Rockefeller Foundation
  • Economic Innovation Group
  • Center on Rural Innovation

Success Stories

Bringing Disaster Relief Grants to Durant, Oklahoma

A multi-state team focusing on the smart-transformation of cities leveraged the U.S. IGS to apply for a disaster relief grant and illustrate the need for targeted disaster relief in the most under-served communities. The grant application highlighted Durant, Oklahoma, which has been hit by two natural disasters in the past five years. The U.S. IGS reflected differences in the levels of inclusion and growth within the communities there.

Rebuilding Erie County, Pennsylvania

In 2019, the Erie Downtown Development Corporation (EDDC) sought out the Mastercard Center for Inclusive Growth to help make the case to investors that Erie's downtown could support a grocery store in a building the EDDC had purchased as part of a $125M transformation of its downtown core. This grocery store, on track to open in the summer of 2021 along with several other minority and women-owned businesses, will help bring life to one of Erie's food deserts and aid in Erie's recovery from declining populations and increasing poverty rates.

Enriching the data of Greater Philadelphia

The Economy League of Greater Philadelphia (ELGP) is a non-profit think tank with the mission to address critical issues facing the Philadelphia Metropolitan Region empowering local decision makers and leaders with data-driven research. To centralize data sources that may help inform economic and fiscal policy to improve inclusion, the Economy League has turned to the U.S. IGS as a source of relevant and valuable insights. With the U.S. IGS's blend of open-source data and a proprietary layer of insights based on Mastercard's aggregated and anonymised transaction data, the ELGP continues to shed light on the state of inclusive growth and shared prosperity in Philadelphia, and identify areas in need.

Investing in underserved communities

In Kentucky, the IGS painted a vibrant picture of an under-served community's economic and social fabric. Through its insights, the tool showcased not just growth, but the flourishing diversity of new businesses and commercial endeavors. For a national lender on the verge of bypassing this opportunity, the IGS illuminated the true value of the community, transforming hesitation into confidence and turning perceived risk into a promising investment.

2023 U.S. IGS™ Report

We explored the evolution of census tracts from 2017 to 2022 in our latest report, 'Growing together: Measuring inclusive growth in U.S. communities and cities'

Receive updates on new data sets, case studies and more.

The Inclusive Growth Score™

Find your score!

Neighborhood-level social and economic data on communities at your fingertips.

Login needed to access the data