The United Kingdom Inclusive Growth Score™

The United Kingdom Inclusive Growth Score™

Empowering U.K. communities with data-driven insights

Explore the map

The Inclusive Growth Score™ tool offers an interactive way to visualize the relative economic and social health of every postcode sector in the UK.

Curious how the tool works? Check out the preview and create an account today!

help_outline

This is a preview of the application for demonstration purposes. Try the full experience →

Overview

Data-driven insights to measure inclusive growth

The United Kingdom Inclusive Growth Score (U.K. IGS) measures social and economic indicators of postcode sectors across England, Wales, Scotland, and Northern Ireland using 21 key metrics from 13 different data sources. The U.K. IGS is a percentile rank ranging from 0-100, with the average score at 50.
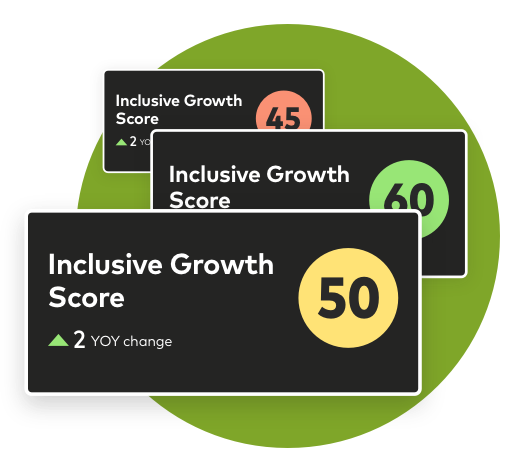
Data-driven insights to measure inclusive growth

Details

Place

Place

Housing, infrastructure, and the built environment

†Mastercard highly aggregated and anonymised transaction data.

  • Inclusion

    Inclusion: Level of access to key resources and assets.

  • Growth

    Growth: Level of change in performance over time.


  • Housing Turnover

    Housing Turnover

    Year-on-year change in the number of houses and flats sold

    HM Land Registry


  • Residential Property Value

    Residential Property Value

    Year-on-year change in property prices

    HM Land Registry, Registers of Scotland


  • Newly Built Homes

    Newly Built Homes

    Year-on-year change in the number of newly built homes

    U.K. Government, NI Dept. of Finance


  • Affordability of Housing

    Affordability of Housing

    Percentage of income remaining after housing costs (England and Wales), share of house price comprised of mean annual income (Scotland and Northern Ireland)

    ONS Income Estimates, Dept. of Finance, NISRA


  • Broadband Performance

    Broadband Performance

    Percentage of premises attaining at least 30MB/s in broadband internet

    Ofcom – Connected Nations


  • Travel Time to Work in Minutes

    Travel Time to Work in Minutes

    Percentage of workers with travel time to work under 35 minutes

    ONS Labour Force Survey


  • Air Quality

    Air Quality

    Air Quality Index (England, Scotland, Wales), count of particulate matter 10 (Northern Ireland)

    Consumer Data Research Center, NAEI

Economy

Economy

Business growth, jobs, and spending.

†Mastercard highly aggregated and anonymised transaction data.

  • Inclusion

    Inclusion: Level of access to key resources and assets.

  • Growth

    Growth: Level of change in performance over time.


  • Net New Business

    Net New Business

    Year-on-year change in the number of businesses based on anonymised and aggregated merchant data

    Mastercard†


  • Spend Growth

    Spend Growth

    Year-on-year change in total brick and mortar spending based on anonymised and highly aggregated indexed transaction data

    Mastercard†


  • Small Business Loans

    Small Business Loans

    Year-on-year change in the number of small busines loans

    U.K. Finance


  • Unemployment Benefits Claimants

    Unemployment Benefits Claimants

    Year-on-year change in the number of residents claiming unemployment benefits

    DWP Alternative Claimant Count


  • Commercial Diversity

    Commercial Diversity

    Percentage of industries represented

    POI Provider


  • Small Business Representation

    Small Business Representation

    Percentage of businesses that are small businesses

    POI Provider


  • Minority Worker Representation

    Minority Worker Representation

    Percentage of minority workers out of all workers

    ONS Annual Population Survey

Community

Community

Economic and social conditions.

†Mastercard highly aggregated and anonymised transaction data.

  • Inclusion

    Inclusion: Level of access to key resources and assets.

  • Growth

    Growth: Level of change in performance over time.


  • Household Income

    Household Income

    Year-on-year change in household income

    ONS Income Estimates, NISRA


  • Spending Per Capita

    Spending Per Capita

    Year-on-year change in card account level spending based on anonymised and aggregated indexed transaction data

    Mastercard†


  • Female Unemployment Benefits Claimants

    Female Unemployment Benefits Claimants

    Year-on-year change in the number of females claiming unemployment benefits

    DWP Alternative Claimant Count


  • Community Wellbeing Index

    Community Wellbeing Index

    Multi-metric wellbeing score developed by Co-op

    Co-op


  • Public Green Space

    Public Green Space

    Percentage of land that is green space within 3KM radius of postcode sector

    Ordnance Survey


  • Education Accessibility

    Education Accessibility

    Count and quality of secondary schools within 5KM

    Geolytix Education Pack


  • Access to Healthcare Services

    Access to Healthcare Services

    Health Services Index (England, Wales, Scotland), distance to nearest GP Index (Northern Ireland)

    Consumer Data Research Centre, Open Data NI

Metric Sources

Success Stories

Addressing UK's Levelling Up Missions

The UK government's levelling up agenda puts forth 12 missions for policymakers to address, including education, skills, housing, and more, with a common underlying thread of boosting economic growth across the whole country The IGS UK platform aligns well with these missions, providing annual, hyper-local data points that may inform a targeted approach in bringing opportunity, investment, and resources where they are currently lacking, and a consistent way to track progress over time. As part of the devolution deals, a key pillar of the UK government's levelling up strategy, there are opportunities to address the economic situation in many regions and local authority districts (LADs) such as York and North Yorkshire.

Analyzing the potential for growth and inclusion in Bristol, as part of achieving its One City Plan

In this paper, we present key metrics to evaluate the social and economic performance of the Bristol City area, based primarily on 2022 data, with 2021 data used for Education Accessibility. A score of 50 for a postcode sector indicates alignment with the national average. The IGS score serves as a tool for benchmarking regions, tracking trends, and guiding resource allocation and investment decisions.

Analyzing the potential for growth in Norwich, as part of achieving its 2040 City Vision.

This report presents key metrics to assess the social and economic performance of the Norwich City area, based on 2022 data, with 2021 data for Education Accessibility. A score of 50 for a postcode sector indicates alignment with the national average. The IGS score aids in regional benchmarking, tracking trends, and guiding resource allocation and investment decisions.

Analyzing the potential for growth and inclusion in the city of Bradford

In this paper, we present key metrics to evaluate the social and economic performance of the Bradford Council area, using 2022 data, with 2021 data for Education Accessibility. A score of 50 for a postcode sector indicates alignment with the national average.

Receive updates on new data sets, case studies and more.

The Inclusive Growth Score™

Find your score!

Neighborhood-level social and economic data on communities at your fingertips.

Login needed to access the data